Waaay back — at least it feels that way — in 2019, Google unveiled Google Analytics 4 (GA4), its eventual replacement for Universal Analytics (UA).
As of March 2023, Google began moving websites that weren’t opted out from UA to GA4. When July 2023 rolls around, Universal Analytics will stop working with any new website data once and for all, though previously-processed data will be available for export for a while longer.
Why the switch from Universal Analytics to GA4?
In this article, we’ll cover what’s special about GA4 and its cutting-edge Realtime Reporting feature.
What’s So Special About GA4 and Realtime Reporting?
This is a move we’re excited about, because GA4 marks a major shift in how website owners can monitor and use data from visitor activity.
Google Analytics
Google Analytics is a web analytics service offered by Google that tracks and reports website traffic. It is currently a program within the Google Marketing Platform brand.
Read MoreWhile UA records every individual request to the website server, GA4 almost instantly tracks every single user interaction across both websites and apps — and captures richer context around them. These interactions are called GA4 events. This approach enables website owners, marketers, and developers to deeply understand the user’s actual journey as they interact with off-site ads, on-site content, conversion points, and more.
GA4 also provides more metrics about visitors and is easier to use with both web and app data visible on the same screen. And there’s one more critical difference — the real-time factor.
GA4’s Realtime reports are the only place where you can view users interacting with your website or application practically as it’s happening.
This means that, for the first time, you will be able to understand, in the moment, who your users are (from the user’s device, what channel they’re coming from, their location, etc.), as well as what they want from their visit (see the pages they’re interacting with, the events they’re triggering, etc.).
While it’s true that there are some limitations on this real-time feature, which we’ll uncover next, this depth of reporting is invaluable for anyone who uses a website or application to drive purchases, downloads, contact form entries, and conversions of any other sort.
Keep reading for our insights into the top features, caveats, and use cases of GA4 Realtime.

A Few Caveats When It Comes to GA4
Understandably, when you see a name like “Realtime” on a feature, you’re going to have certain expectations.
In this section, we’ll cover some slight eccentricities and differences from UA that website owners and managers should know as you start using GA4.
Expect a Slight Delay With Some Data
Google says that data from apps is batched to save battery life. That means data will be served at a delay, but it should only be a few minutes behind. In our opinion, this isn’t anything to worry about, but we want to be clear that in the case of applications, “Realtime” is a slight misnomer.
Filters Mean Traffic May Look Different From UA
GA4 intends to filter out traffic coming from spam and bots. While this is a good thing, it may cause your traffic reports to look a little lighter than they did in UA, which may take some getting used to (and educating if you’re handling analytics on behalf of the site owner.)
Limits on Personalization
The Realtime reporting screen in GA4 isn’t very customizable. You can certainly dig into the data using their comparison and snapshot features — which we’ll show you how to do shortly — but that’s where the personalization ends.
The Nature of Realtime is That It’s Fleeting
One of the core features of Realtime reporting is that it displays user activity over the last 30 minutes, and you can only share this reporting via a link. There is no option to export data, as the minute it’s downloaded, it would no longer be real-time.
As such, it may be challenging to gather and report on your learnings from Realtime the same way you have with UA in the past.
Realtime vs. DebugView
Interestingly, another feature known as DebugView was added in GA4. This feature lets you look at data similar to the way Realtime does.
While both support web and app data streams, Realtime uses comparisons to display data for a specific stream, and DebugView lets you filter by device. DebugView can also display user activity for longer than 30 minutes, but it doesn’t have the intriguing user snapshot view that Realtime does (which we’ll talk about in more detail later.) DebugView requires more setup, which is why it’s most often used by developers and tech-inclined marketers who are laser-focused on detailed metrics.
Whether you choose to use Realtime or DebugView is up to your preferences and goals, but if you want to explore more, here’s Google’s guide to getting started with DebugView.
How to Navigate to GA4’s Realtime Reporting
Ready to take a peek inside your own GA4’s Realtime reporting dashboard?
First off, if you haven’t switched over from UA to GA4 just yet, here’s everything you need to know.
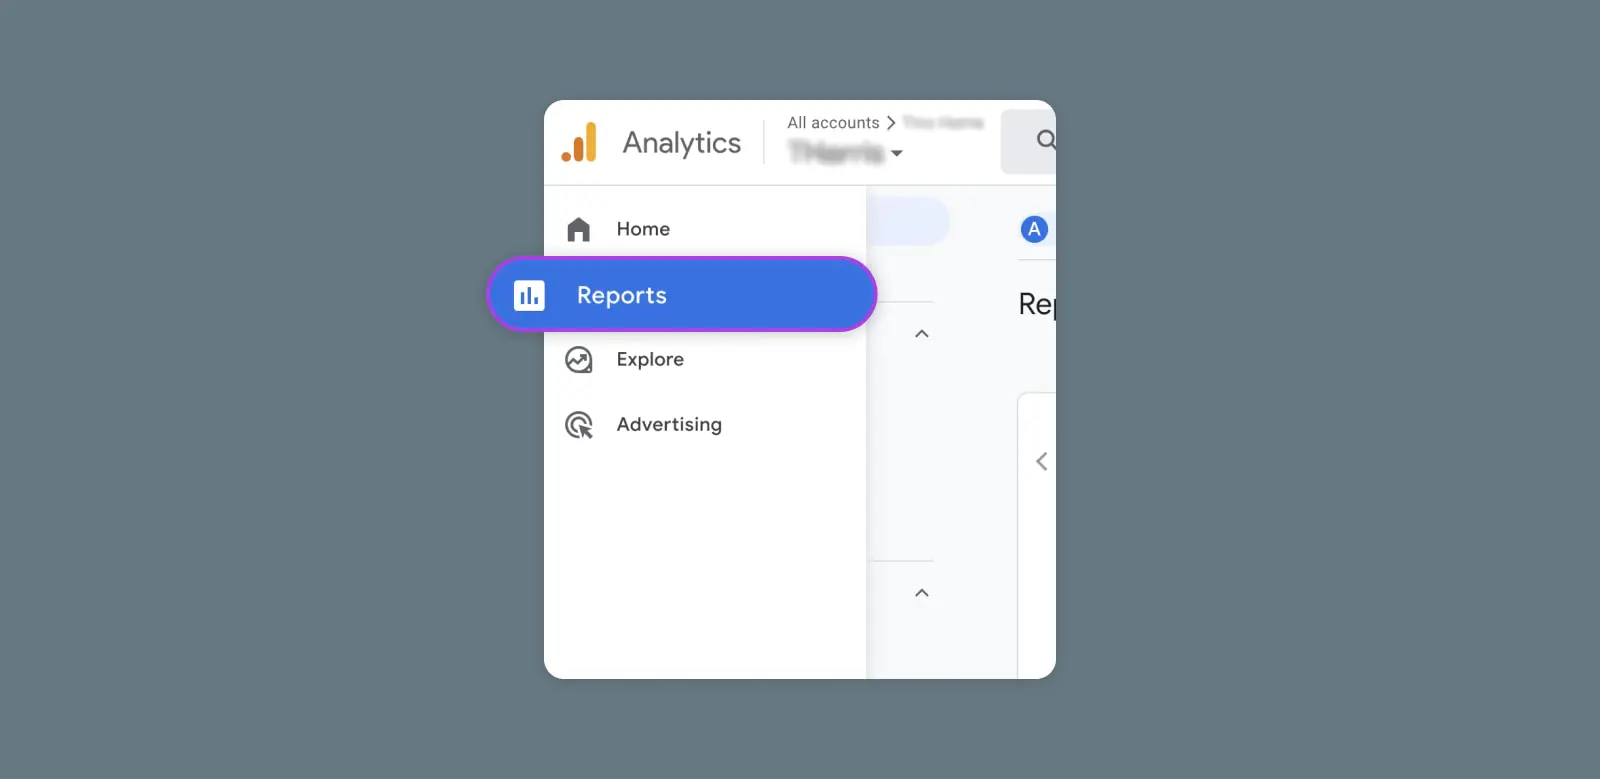
Once you’re sure you’re up to date, start by navigating to the account and GA4 property/app which you want to analyze. On desktop, find this in the upper left corner of the screen near the Analytics logo. You want it to say All accounts > The account you want to work with today.
Now you should be at GA4 Home. In the sidebar, click the Reports icon to open the Reports snapshot page.
Look to the left sidebar again and choose Realtime to finally pop open the Realtime overview!
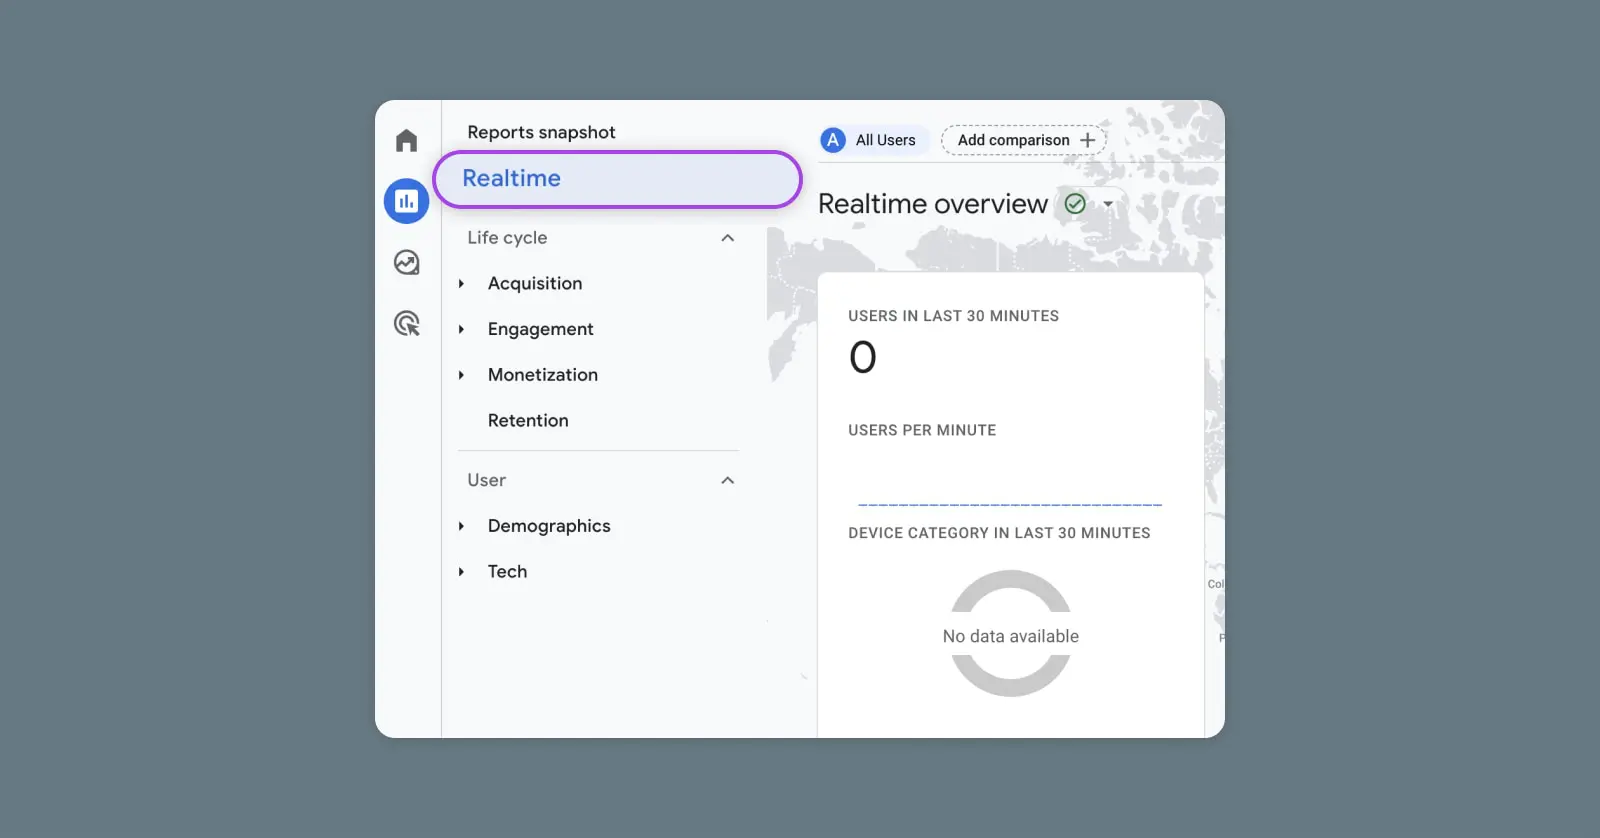
What you’ll notice here are a bunch of “cards,” some of which can be changed via a dropdown menu, displaying all the data a GA4 Realtime report has to offer:
- Users in last 30 minutes: Number of users on desktop, mobile, and tablet in the last 30 minutes
- Users by source: View active users by a multitude of filters — first user source, first user medium, first user source/medium, first user source platform, and first user campaign.
- Users/New users by Audience: The audiences to which users belonged when triggering events during the report’s date range. (Learn more about audiences here.)
- Views by Page title and screen name: Number of app screen/web page views, counting repeats.
- Event count by Event name: How often visitors trigger certain events. (See how to create events here.)
- Conversions by Event name: The number of times web or app visitors triggered a conversion event. (More on measuring conversions here.)
- Users by User property: Audience attributes you want to track, like location, language, etc. Google Analytics already tracks some predefined dimensions, but you can also add custom properties when you go to Admin > Custom definitions.
Dots on the map will show you where users are located, and you can click on these to learn a little more about visitors in different areas. Clicking on a dot also creates a comparison — so let’s go ahead and explore that feature now.
Digging Deeper: Realtime’s Advanced Features
GA4 Realtime reporting may not have the same customization we’re used to with UA, but it does have a few capabilities that allow you to slice and dice the data in interesting ways.
Comparisons
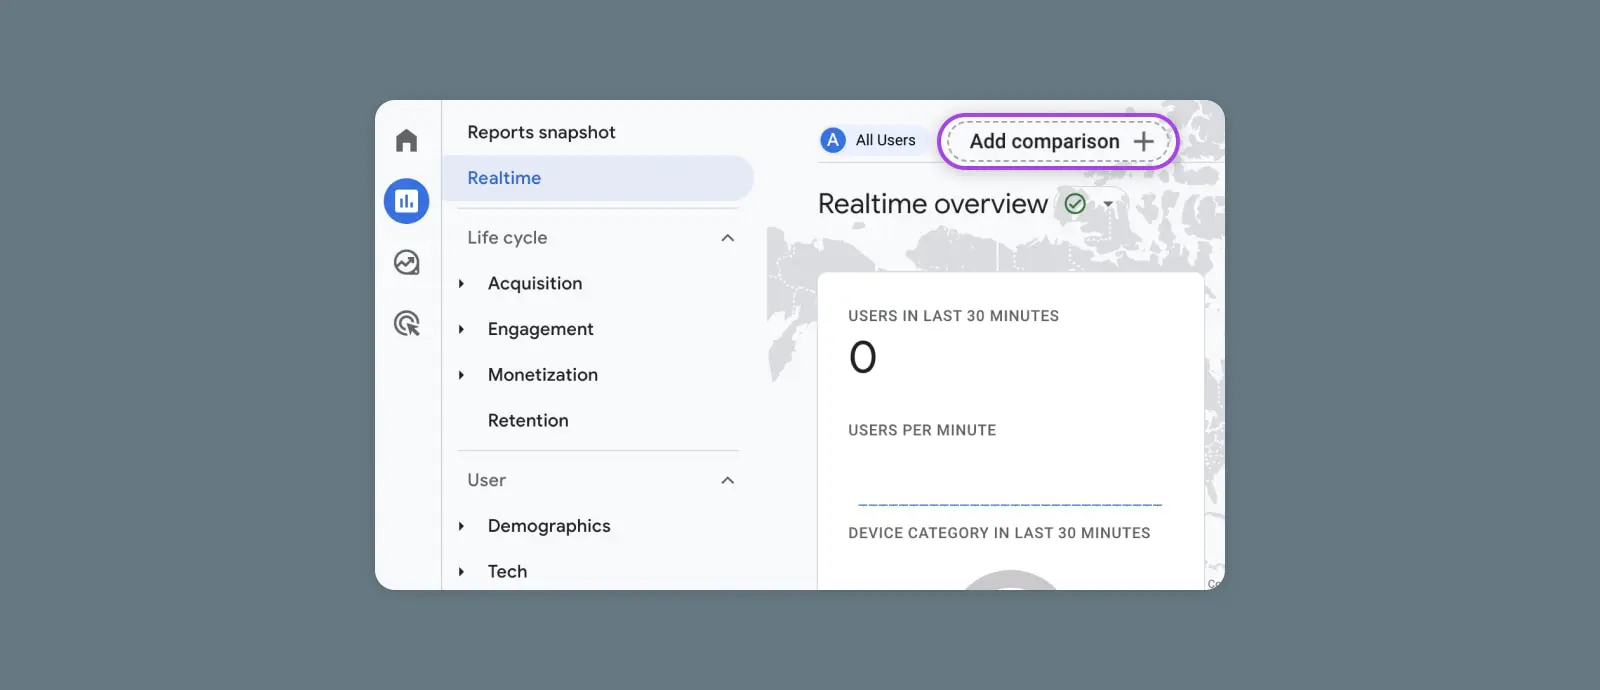
Comparisons enable you to compare specific subsets of users. Add a comparison by navigating to the “Add comparison” button at the top left of the Realtime screen.
A sidebar will slide out on the right, where you can choose dimensions such as age, region, device, time, traffic source, etc. You will also choose dimension values. So if the chosen dimension is Platform, value options will include Android, iOS, and Web.
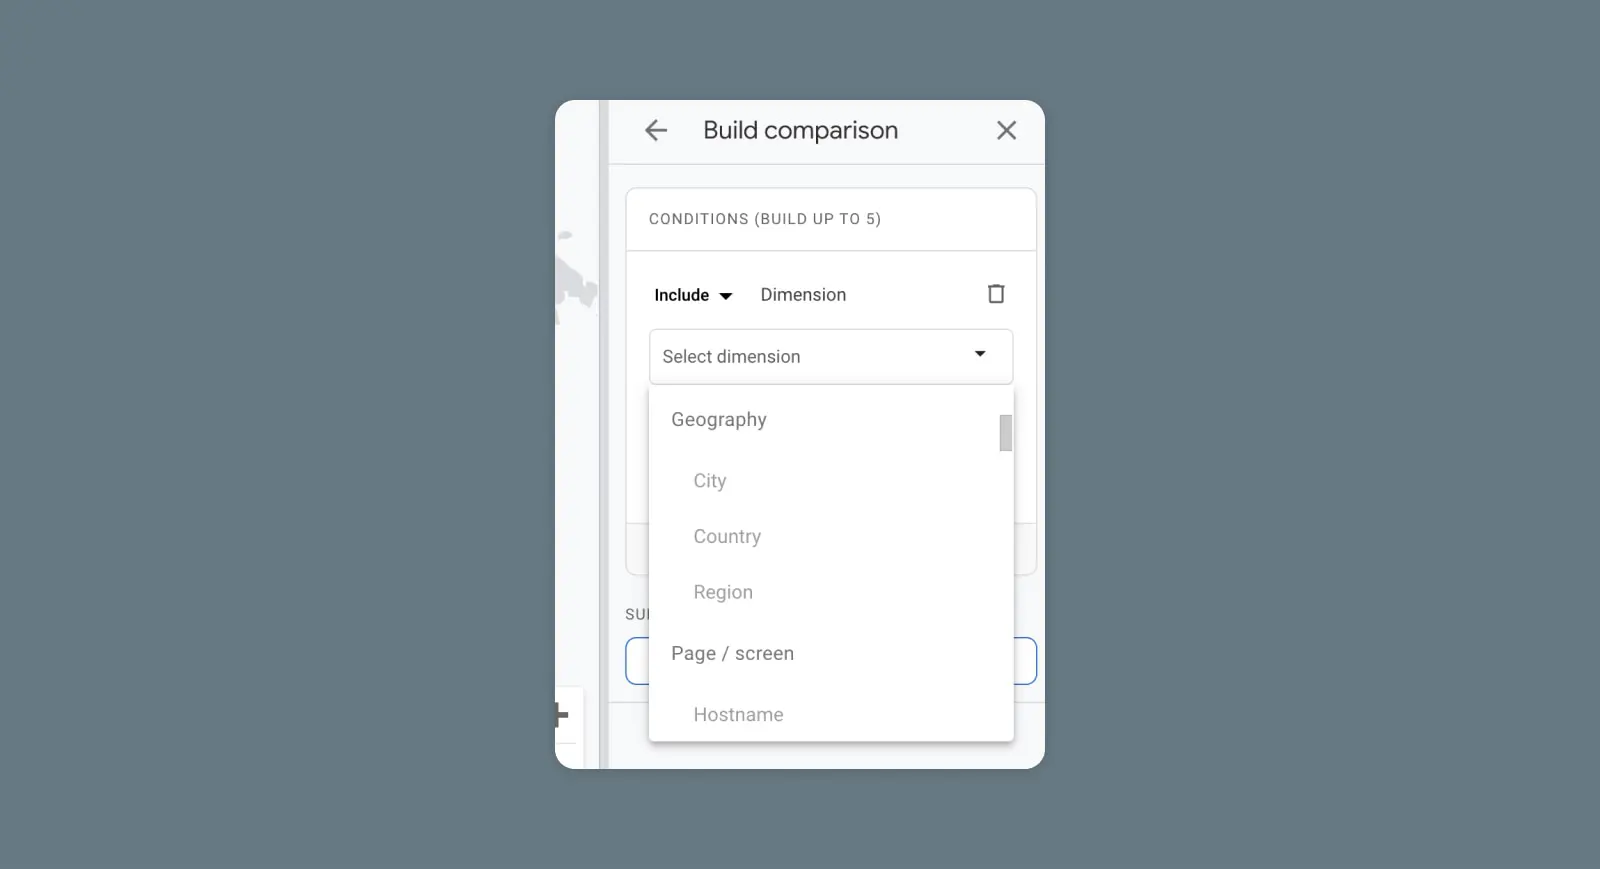
When you hit Apply, you’ll see the Realtime overview page displaying the default All Users group and the comparison you just created. You can create and view up to four comparisons at once, and you can remove the default All Users group and replace it with your own custom comparison.
User Snapshots
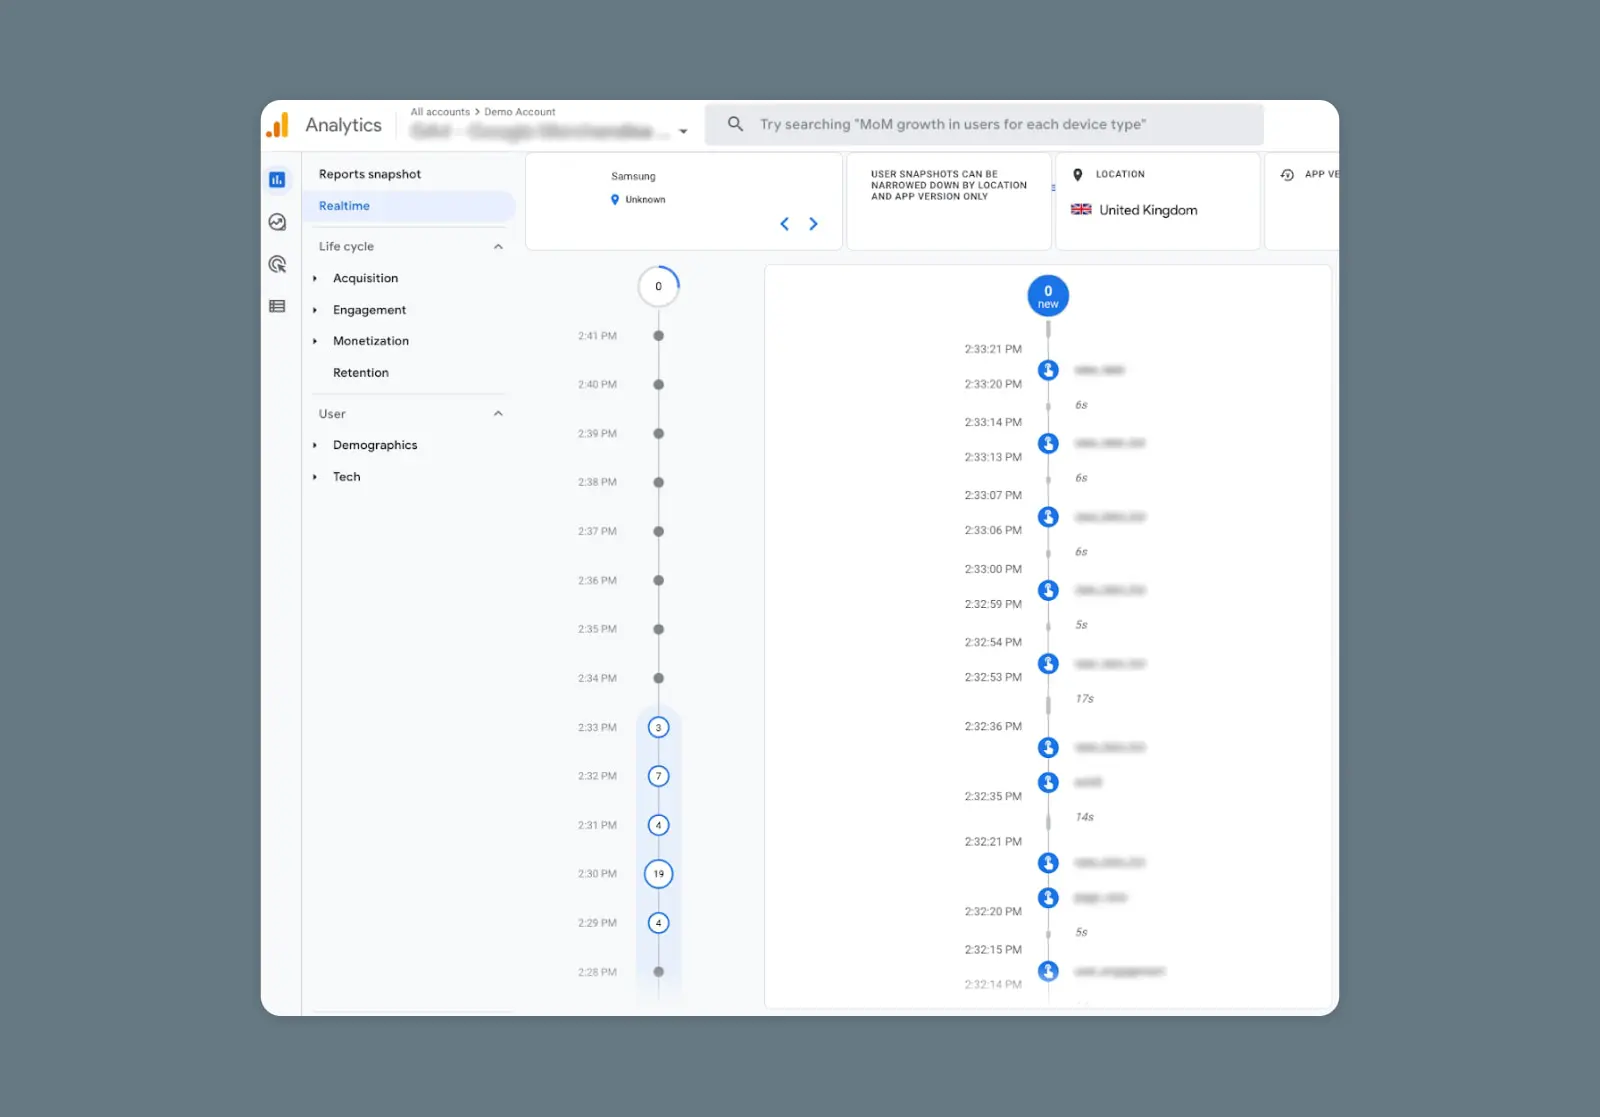
Realtime enables you to see the actual, live(ish) behavior of an anonymous, random user in its user snapshot screen. Navigate there using the “View user snapshot” button on the upper right of your screen.
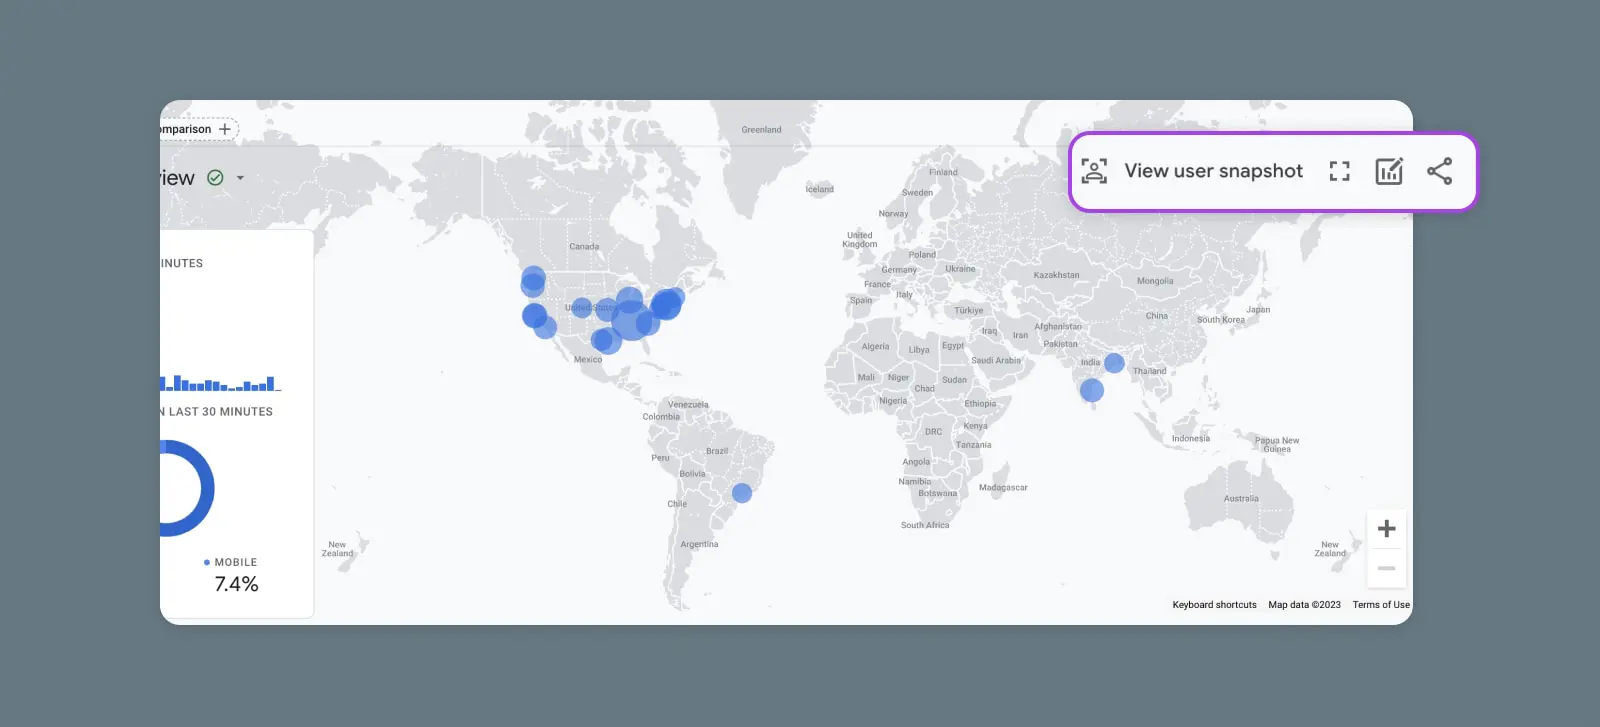
Here, you should get a visual showing the events this user has triggered along a timeline and information such as their device, location, and properties.
How to Get the Most Out of GA4 Realtime Reporting
Use Realtime to fully understand your audience and their preferred journeys, deliver the kind of content and features they truly want to interact with, and implement campaign tracking that makes it easy to continuously iterate and improve.
Fund the Most Effective Features and Campaigns
Yelling into the void might be an effective tactic for letting off steam after an especially long week at work, but it’s decidedly ineffective when it comes to marketing and feature creation.
With GA4 Realtime, you have one of the most accurate looks you can get into what your audience actually engages with on your website or app. Use it to launch content and features and run extraordinarily fast tests to determine if they’re landing with the intended audience.
No more guessing. No more releasing carefully crafted digital marketing messaging or cool new app experiences into the void and crossing your fingers that they’ll connect with your audience. Just real-time guidance on where to pivot away from what isn’t working and where to double down on the articles, CTAs, buttons, product pages, and other elements your audience is going nuts over.
Nail Your ICPs
Speaking of your audience, knowing your businesses’ core ideal customer profiles (ICPs) is another critical factor in building campaigns and products that land with the folks you want to convert and retain.
Realtime provides insight into your real ICPs by uncovering user demographics and patterns, preferred channels, the types of tech they use, the kinds of content they relate to, and so on.
Ensure Campaign Tags Are Working Properly
With Google Tag Manager, marketers can use tracking codes to “tag” campaigns and see who’s clicking on their content and from which channel (social media, guest blog posts, email marketing, etc.).
Realtime gives you a fast and simple way to ensure your campaigns, and campaign tags, work as intended. If you launch a new campaign and aren’t seeing any traffic — your configuration may need a little work. Or, if you are getting traffic but not the kind you want, you can quickly adjust it to hit the right ICP and boost impact in no time.
Learn more about using Google Tag Manager to add events to Google Analytics.
Build for *Actual* User Journeys
Again, Realtime reporting is all about eliminating guesswork, cutting through the noise, and building what moves the needle for your business.
User snapshots are one of the many touches that makes GA4 so distinctive compared to other analytics tools. You get insight into an actual, real-life user journey that tells you exactly how visitors behave and what they want to engage with — unhampered by observation bias and more accurate than third-party heat mapping and other tracking tools.
With that, you can build features and content for the journeys your users are actually on, not aspirational ones based on old data and best guesses.
The insights from and the use cases for GA4 Realtime reporting are incredibly robust — but we understand if the amount of time left in your work day isn’t.
Admittedly, it can take quite a bit of time and effort to get up to speed on GA4 and apply Realtime to its maximum potential. For a helping hand, schedule a marketing consultation or start a chat with our team of marketing pros. At DreamHost, our mission is to help you succeed.

Get More Visitors, Grow Your Business
Our marketing experts will help you earn more traffic and convert more website visitors so you can focus on running your business.
Learn More